

Ax-3-Domaines: History, VAMs and performance predictions
Ax-3-Domaines: History, VAMs and performance predictions for the 2013 Tour's first mountain finish


The pVAM can be thought of as a "benchmark" method, using previous performances to predict current performance in a way that controls for the key variables affecting it. If a performance is better than historical/typical values, then it will produce a higher actual VAM than pVAM, and so the overall quality of races and performances can be compared. You'd expect the fastest ascent per climb, and overall GC winner to be better than the pVAM, incidentally, because the pVAM is derived from the best three performances, not the very best on the day, or even overall.


But, once the day is done, and the times are in, we'll be able to slot 2013 into the figures above, and show all the estimates and actual performances. If anyone does make SRM data available, I'll also use that to validate the estimates as much as possible.
As the Centenary Tour de France enters the Pyrenees for its first mountain finish of the race, we analyze the first major climb, Ax-3-Domaines.
The data used to produce the figures below was provided by Ammatti Pyoraily, who is a must-follow on Twitter if you are into rapid time performance data, climb profiles, historical records - it's an incredible collection of data, so a huge thank you for providing it.
The climb
Below is the climb, 8.9km long at an average gradient of 7.46%, and divided into five sections. It starts steeply, 8.9% and 8.3% for the first 1.3 and 2.7km, respectively. It doesn't drop below 8% until the last kilometer, where it is actually relatively flat. This has implications for calculated power output (based on models) because they become less accurate as gradient flattens out. It also means that if the climb is going to separate riders, it will happen lower down, and whoever is together with around 2km to go will probably hang on to the line. Expect hard efforts early.

The more a climb can be segmented (provided of course the segmentation and timing are accurate), the more accurately a model can be applied. It also allows differences due to wind direction to emerge. I recall attending an ACSM conference in 2005 and someone had modelled Alp d'Huez into 21 segment, hairpin by hairpin, and there was a clear impact of a slight wind, because odd numbered segments produced a higher calculated power output than even numbered segments, as the wind shifted from tail- to headwind. These are some of the assumptions that have to be kept in mind when estimating performance in the mountains.
Power outputs and performance
Nevertheless, we can estimate the climbing time for a range of power outputs, as shown by the graph below.

This was done using the CPL model, but they all produce values that are pretty similar - there's more error in timing and wind assumptions than the actual calculated value. I chose CPL because it produced the best correlation with SRM data (r = 0.94), and did this for a 70kg rider and 8kg equipment. Within the relatively narrow range of Tour cyclist sizes, the relative power output is probably the key, shown in grey above the x-axis.
Ax-3-Domaines, at around 24 minutes, is a medium length climb. On the shorter climbs, we expect higher power outputs. In 2010, Chris Horner produced 6.6 W/kg for the final 10 minutes of a stage in which he lost about 30 seconds to the leaders, and 5.8 W/kg for 23 minutes of climbing on the steep part of Ax-3-Domaines, losing around 80 seconds to Contador and Schleck.
Using his power output (which was directly measured with SRM), it is possible to estimate that of the front of the race, and it showed that Contador/Schleck were at around 6.8 W/kg for 10 minutes, and 6.2 W/kg for 24 minutes. We also know that on Alp d'Huez, the last few ascents have produced around 6 W/kg for 41 minutes, and so it is fairly clear that a) expected power output is affected by duration - you'd think this would be obvious, but sometimes creates confusion and leads people to label performances "impossible" when all you're seeing is a normal high-intensity effort for a shorter period, and b) we can fairly reliably predict where the power output will be for a given length of climb.
The pVAM method
One such prediction method, developed by Scott Richards and explained here, is the pVAM method. Basically, what was done was to gather the climbing performance data from the Grand Tours in the period after the biological passport was introduced (2008 to 2013). He then calculated a VAM, or Vertical Ascension Rate in meters per hour, for every climb for the top 3 in the GC race.
The strength of this method is that it allowed him to develop an equation that not only accounted for the length of the climb, but also the gradient and the altitude - the higher you go, the lower the power output and hence VAM. The equation was: pVAM = 2938.5 – 0.1124 vclimb + 476.45 ln(gradient)
Using the pVAM method for Ax-3-Domaines, the estimated time for the climb is 24:17. That performance corresponds to a VAM of 1617 m/h, and using Dr Michele Ferrari's equation (which I explained previously here), a power output of 5.98 W/kg.
Historical perspectives
To frame that performance against those of the past, let's take a look back at Ax-3-Domaines, which has been done four times - 2001, 2003, 2005 and 2010.
First, the figure below shows the top 50 times on the climb.

This is a typical figure for Tour mountain climb rankings - heavily weighted towards performances from the 90s and 2000s - you'll see the same for Alp d'Huez when we head into the Alps in a few weeks' time. We have repeated this often, but the sport has slowed down, sometimes considerably, since the biological passport was introduced co-incident with the greater focus on doping, driven by sponsor and media pressure to eradicate it. It doesn't guarantee that the sport is clean (in fact, I highly doubt it is), but I do think the performance tells of less doping by fewer riders, and that's progress.
Ax-3-Domaines offers the same "qualified hope" - the top 12 performances pre-date this era (and then it is Menchov), though the climb is too new and infrequent to have the strength of history to really support any historical comparisons. That's why I'd caution against isolating today's performance, whether it is super fast or slow, and using it as "proof" of anything. Aside from the fact that performance will never prove clean vs doped, it's important to let the whole Tour unfold, with dozens of mountains, and then look at the climbs in context, with a big picture view.
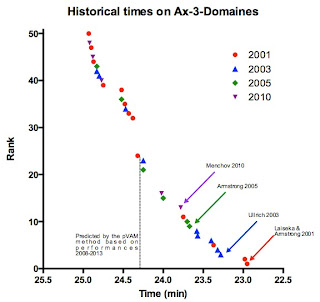
But what of performance implications? The figure below shows the climb time as a function of VAM (they're really just the same performance metric, expressed differently) and also relative power output (in grey on the x-axis). I've indicated the pVAM prediction, and the fastest ascent times in each of the four years in the Tour so that you can get an idea of the power requirement to achieve those performances. They belong to Laiseka (2001), Ullrich (2003), Armstrong (2005) and Menchov (2010). Six men have gone under 23:30 on the climb, also shown on the graph below.

At this point, it's worth noting that for ease of use, I've estimated relative power output based on VAM, as per Ferrari. This method produces good agreement when a rider is around 65 to 70kg. For lighter riders, VAM-derived power output tends to under-estimate the performance, whereas for heavier riders, it over-estimates it. This is because Ferrari didn't account for size (mass and body surface area which affects drag) in his derived equation. I've actually got some interesting modelling data comparing VAM-power to other models, and perhaps when the Tour leaves the mountains I will explain that more. But just be mindful, the relative power output that is calculated based on VAM seems to be around 2-3% lower than actual power outputs for the 65-70kg rider producing Tour-performances (speed and duration). That 24:17 prediction, for example, corresponds to 6 W/kg using VAM, but is in reality closer to 6.2 W/kg.
Segment timing and analysis
And then finally, using the climb profile and the five segments, let's look at the best times from those eras and estimate the requirements to produce them. To repeat, the more segments, the more reliably you can compare and observe possible influence of wind direction on performance. The figure below shows the best performances per year by segment, for time, VAM and relative power output (bear in mind, this is likely to under-estimate real power output by 2-3%). I'll leave the year-by-year comparisons to you to make, with the reminder that some of the variance may be due to wind direction.

As would be expected for pretty much any endurance exercise, the beginning and end show the highest power outputs. This is a typical pacing strategy for endurance sports - start fast, middle lull, then end-spurt. Ax-3-Domaines probably exaggerates this because of the very steep first 1.3 km and the increase in steepness again in the penultimate kilometer, before it flattens out a little. That hints at the tactics you'll see later, because it's not the sort of climb where you'd wait for a steep middle section to attack - it'll be hard from the bottom, sustained, and attritional. Riders will drop off progressively as they pay for the fast start, rather than being split suddenly by mid-climb moves.
In terms of a prediction, I mentioned that the pVAM method predicts a 24:17. I expect it will be faster than that, because we're only in the first week of the Tour so riders are fresh, it's the first mountain finish so motivation will be higher, and the model prediction is based on three GC riders anyway - the best will be faster. If I had to gaze into my crystal ball, I'd predict a time between 23:40 and 23:50, corresponding to between 6.2 and 6.3 W/kg.
But, once the day is done, and the times are in, we'll be able to slot 2013 into the figures above, and show all the estimates and actual performances. If anyone does make SRM data available, I'll also use that to validate the estimates as much as possible.
So enjoy the day's racing and do join me tomorrow for the post-climb analysis, where we can add to the figures above. Once again, huge thank you to @ammattipyoraily for the numbers and data.
Ross
![]()


0 Comments:
Post a Comment